Data Visualization for library
Project made as part of “Object Oriented Programming” course.
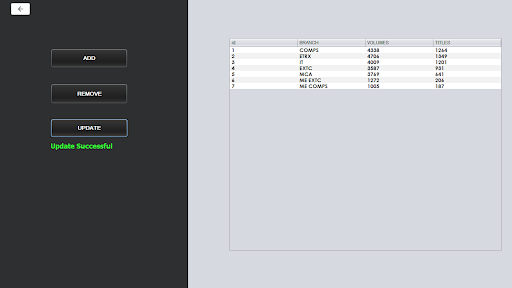
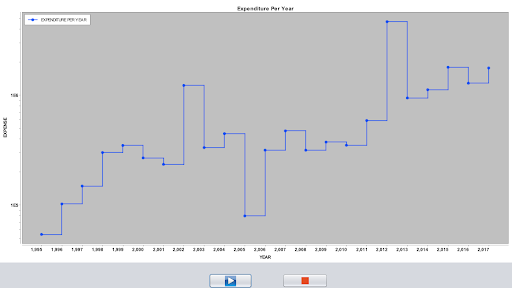
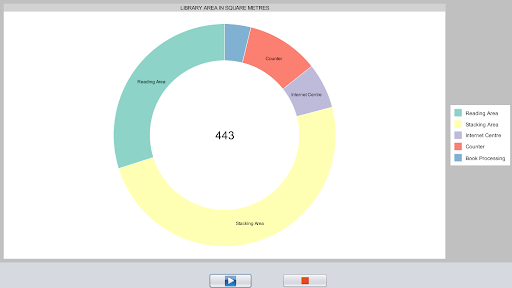
A Java desktop application which displayed library data in graphs on a slideshow.
Features:
- Users can view / modify / add / delete library data.
- Users can start a slideshow of the graphs.
Tech Stack:
- Java Swing :- For the GUI
- MySQL :- Database
- XCharts :- To generate graphs of data.
Source: Code